
Start Here: The Norman System — How Systems Fail Under Pressure
How systems lose the ability to act in time—and why most leaders don’t see it happening

EXECUTIVE WHITE PAPER
Norman’s Gap
A Diagnostic Framework for Leadership Under Pressure
Decision Speed • Signal Integrity • Internal Regulation
.

By Norman Applegate
Founder, The Daily Signal • Author, Regulate
© 2025 Norman Applegate. All rights reserved
No part of this publication may be reproduced, distributed, or transmitted in any form or by any means, including photocopying, recording, or other electronic or mechanical methods, without the prior written permission of the author, except in the case of brief quotations embodied in critical reviews and certain other noncommercial uses permitted by copyright law.
The following concepts, frameworks, and named laws are the original intellectual property of Norman Applegate and The Daily Signal:
• Norman’s Law
• Norman’s Gap
• Signal Compression (as defined herein)
• The Norman Decision Window
• Norman Decision Time
• The Norman Failure Condition
• Internal Signal Compression
• Regulated Decision Time
• Window Separation (as defined herein)
• The Daily Signal Signal Score and diagnostic methodology
For permissions, licensing, speaking, consulting, or publishing inquiries:
The Daily Signal • Norman Applegate • normansapplegate@mac.com
First published 2025. Printed in the United States of America.
Norman’s Law — When external pressure exceeds internal regulation, instability follows.
TABLE OF CONTENTS
The Real Problem.....................................................................................................................…........... 5
The Seven Laws........................................................................................................................................ 5
The Complete Causal Chain.....................................................................................................……………….................. 8
The Three Failure Points...............................................................................................................…………............ 9
Measuring Norman’s Gap..................................................................................................................…………….......... 10
2.1 External Pressure.............................................................................................................….................. 10
2.2 Internal Regulation.........................................................................................................….................. 11
The Decision Window Framework...................................................................................................……………............ 13
3.1 Window Separation — The Most Dangerous Failure Mode..........................................................……………………………………….………………………….......... 13
3.2 The Container Scenario — Window Separation in Real Time.........................…………………………………………………………………………..................................... 13
3.3 Norman Decision Time as the Primary Leadership KPI..............................................................………………………………………………………………….......... 14
3.4 Regulated Decision Time — Where MOS Meets IOS....................................................………………………………………………………………......….............. 14
The Role of the Observer..............................................…...................…......................................................... 16
Recommended Scoring Protocol....................................................………………............................................................ 16
Calculating and Interpreting the Gap..........................................................................…………………………................................... 17
Gap Score — Public Metric............................................................................……………......................................... 17
Gap Index — Executive Instrument...............................................................................………………........................... 17
Direction Indicator............................................................................................................................. 17
Applied Examples............................................................................................................................ 19
Example 1 — Sustainability Initiative (System Level).....................................................................…………………….………………………………......... 19
Example 2 — Container Shortage (Norman Decision Window / Event Level)....................…………………………………………………………………………………….....…................... 19
Example 3 — Supplier Alert Decision (Regulated Decision Time / Human Level)...............................…………………………………………………………………………………………........... 20
Practical Application........................................................................................................................ 21
MOS Integration — Three Structural Points.............................................…………………………………...........…..................................... 21
IOS Integration — The Inner Operating System......................................................................………………………………………................... 21
Longitudinal Application........................................................................................................................ 22
Framework Development..................................................................................................................... 24
Supporting Literature and Disciplines...................................................……………………................................................. 24
A Note on Replication......................................................................................................................... 25
ABSTRACT
Organizations rarely fail because they lack information. They fail because they cannot respond to it in time.
This paper introduces a diagnostic framework built on seven named laws and conditions. Each is precise, measurable, teachable, and independently applicable. Together they form a unified system describing the complete causal chain from pressure to failure — and providing the diagnostic tools to interrupt that chain before the outcome locks.
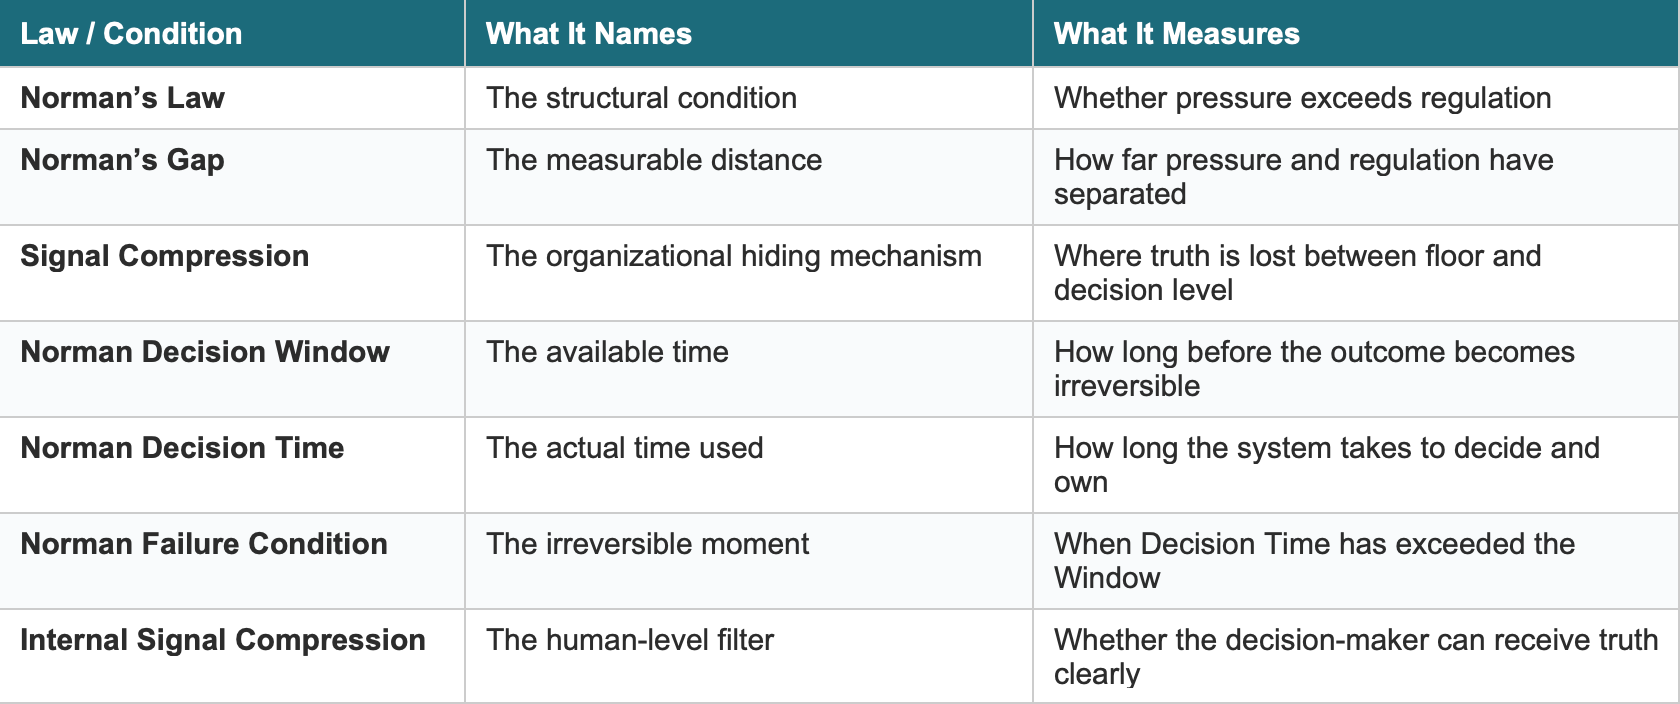
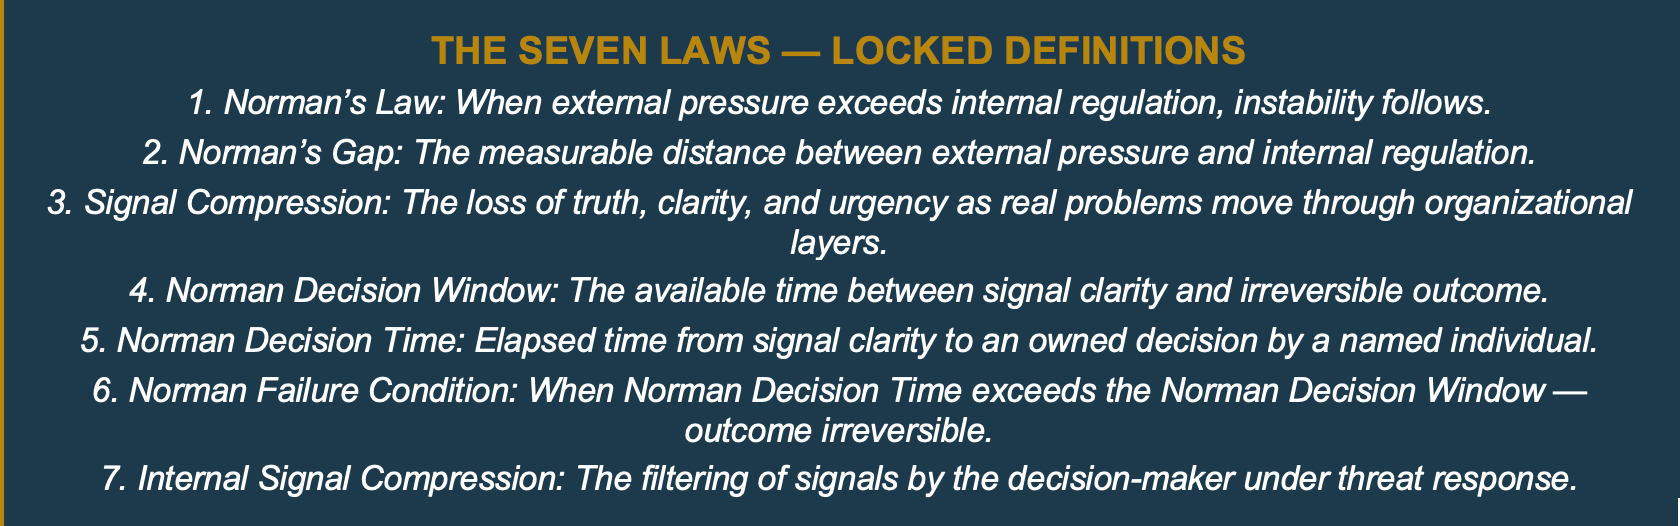
The Seven Laws
Norman’s Law establishes the foundational principle: when external pressure exceeds internal regulation, instability follows. Norman’s Gap defines the measurable distance between them. Signal Compression names the mechanism that hides the gap — the loss of truth, clarity, and urgency as real problems move through organizational layers. The Norman Decision Window defines the available time between signal clarity and irreversible outcome. Norman Decision Time measures the elapsed time from signal clarity to an owned decision made by a named individual. The Norman Failure Condition identifies the precise moment Norman Decision Time exceeds the Norman Decision Window — producing an outcome that is no longer correctable. Internal Signal Compression, the advanced layer, names the equivalent filtering mechanism that operates inside the decision-maker under threat response — the human-level parallel to organizational Signal Compression.
Together, these seven concepts answer a question most leadership frameworks never ask:
Can your system carry truth clearly enough, and decide fast enough, to act within the window the situation provides?
The framework produces four measurable outputs: a Gap Score defining the distance between pressure and regulation; a Gap Index revealing the imbalance ratio; a Norman Decision Window defining the available time; and Norman Decision Time measuring whether the system is using that time effectively.
When Norman Decision Time exceeds the Norman Decision Window, the Norman Failure Condition has been met. The outcome is locked. This framework makes all four measurable — before that condition is reached.
Methodology
The framework presented in this paper was developed through direct field observation and applied practice across manufacturing, operations, executive leadership, and organizational consulting contexts. The scoring models, behavioral anchors, and diagnostic thresholds are practitioner-derived — built from observable organizational behavior, not modeled from theoretical constructs. They represent calibrated starting points subject to ongoing refinement as the diagnostic dataset grows. The named laws and conditions are original intellectual contributions. Where existing literature is relevant, it is noted in the Sources section.
SECTION 1
The Real Problem
In complex organizations, problems are rarely invisible. They are seen. They are discussed. They appear in reports, flagged in meetings, and acknowledged at the executive level.
Yet outcomes continue to degrade. Deadlines slip. Costs climb. Execution slows. Initiatives stall between declaration and delivery.
The prevailing assumption is that better strategy, stronger culture, or improved performance management will close the gap. Leaders invest in these areas — and the gap persists.
The reason is structural, not motivational. Most leadership frameworks measure what a system produces. Very few measure whether the system can absorb and respond to reality at the speed it arrives. Fewer still measure whether the person at the decision level can receive that reality clearly — without internal distortion — and act within the window the situation provides.
The Seven Laws
This framework is built on seven named concepts forming a single coherent causal chain. Each law is defined precisely, grounded in observable behavior, and measurable in practice. Understanding one requires understanding all — because organizational failure rarely isolates itself to a single link.
No part of this publication may be reproduced, distributed, or transmitted in any form or by any means, including photocopying, recording, or other electronic or mechanical methods, without the prior written permission of the author, except in the case of brief quotations embodied in critical reviews and certain other noncommercial uses permitted by copyright law.

Norman’s Law is the foundational principle. It is not domain specific. It operates identically across organizations, markets, biological systems, and individuals. Pressure is constant. Instability is not inevitable. The determining factor is always regulation — the system’s capacity to absorb, adapt, and respond.
The law does not predict failure. It identifies the condition under which failure becomes probable. A system can operate under significant pressure indefinitely, provided its internal regulation is sufficient. The moment regulation falls behind pressure, instability begins to form — quietly, predictably, and measurably, before it appears in any outcome metric.
This is observable before outcomes degrade. Delayed decisions, diffused ownership, distorted metrics, and reactive leadership behavior are all early indicators. They are not performance problems. They are regulation problems. Treating them as performance problems is why most interventions fail.

Norman’s Gap is the operational expression of Norman’s Law. Where the law identifies the condition, the Gap provides the measurement. It is not theoretical — it is visible in organizational behavior before it appears in financial or operational outcomes.
The gap reveals itself through four observable patterns: decisions that should take hours take days or weeks; accountability is diffused across teams rather than assigned to a named owner; metrics are summarized, adjusted, or softened before reaching decision-makers; and leaders react emotionally under pressure rather than making clear trade-offs. Each of these is a regulation failure, not a performance failure. That distinction determines what an effective intervention looks like.
Leaders who learn to read these behavioral indicators gain significant diagnostic lead time over those who wait for results to confirm what the system was already communicating.

Signal Compression is the mechanism that hides Norman’s Gap until it is too late to close. Every layer in the escalation chain applies its own filter: personal experience, political safety, emotional bias, career risk calculation. The signal is not passed upward. It is translated. And every translation introduces loss.
What begins as a specific constraint at the floor becomes a risk, then a watch item, then a discussion point. By the time it reaches the person with authority to act, the urgency that would have triggered action has been translated out of it. The decision-maker receives a version of reality that is not false — just softened beyond utility.
Signal Compression is not accidental. It is built into the system. Every organizational failure in history has this as a precondition: the Roman Senate receiving filtered reports from the frontier for decades before the western territories became indefensible; McNamara’s body counts replacing ground truth in Vietnam until the strategic picture was unrecognizable; the FDA receiving summarized trial data stripped of the specificity required for accurate risk assessment. The mechanism is always the same. Reality exists at the point of contact. By the time it reaches the decision level, it has been made comfortable enough to present — and far too diluted to act on correctly.

The Norman Decision Window is not the time until the meeting. It is not the time until the report is due. It is the time until the situation no longer accepts intervention — when the line stops, the customer’s logistics window closes, the contract penalty triggers, or the regulatory deadline passes.
Most organizations know their Decision Windows intuitively at the floor level. The people closest to the constraint understand exactly how much time they have. The problem is that this knowledge rarely travels with the signal. When the signal is compressed at any layer, the clock stays behind at the floor. Leadership receives the problem without knowing the time. This is Window Separation — a named failure mode addressed fully in Section 3.
The Norman Decision Window is predictive as well as descriptive. Because the window can be measured for recurring decision types, organizations can identify in advance which decisions carry the shortest windows and build the structural disciplines — ownership assignment, escalation speed, authority pre-authorization — required to act within them consistently.

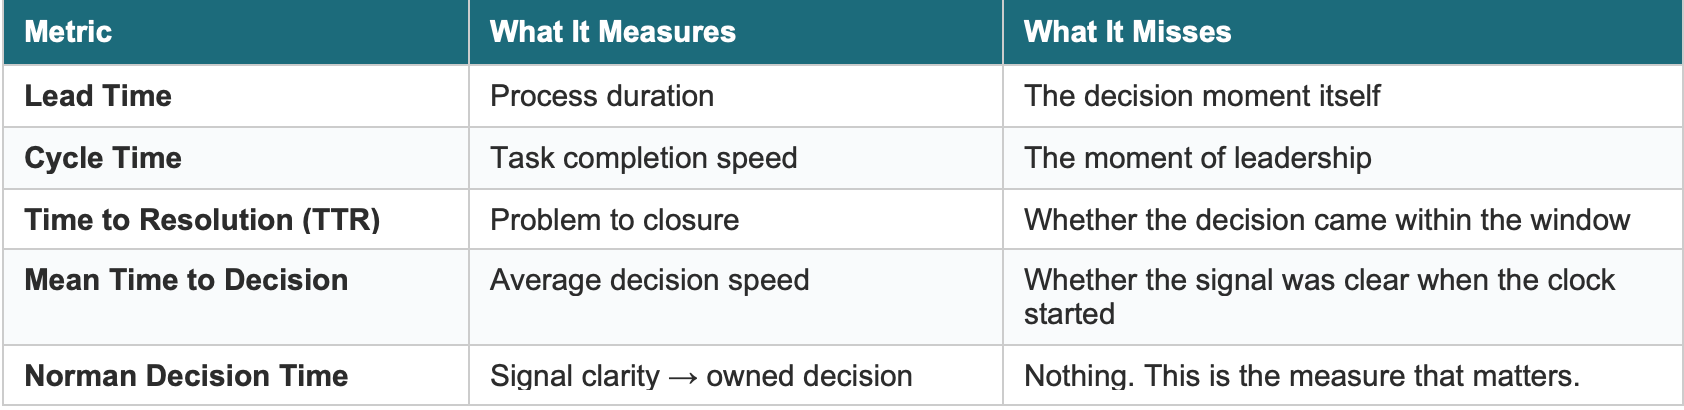
Norman Decision Time is the measurement most operational frameworks miss entirely. Existing metrics — Lead Time, Cycle Time, Time to Resolution, Mean Time to Decision — measure what happens before and after the decision. The decision itself has been treated as an instantaneous event: a binary flip between undecided and decided.
Norman Decision Time identifies that the decision is not instantaneous. It has a duration. And that duration is determined by two variables operating simultaneously: the external system’s ability to carry a clean signal with the window attached to the right decision level, and the internal system’s ability to receive and process that signal in a regulated state.
Norman Decision Time is the primary KPI of leadership behavior under pressure. It makes leadership behavior directly measurable — not indirectly through outcome metrics but at the moment of decision itself. It can be tracked at three levels of granularity: signal to escalation, escalation to ownership, and ownership to decision. Each component identifies a different failure point in the system.

The Norman Failure Condition is the precise moment Norman’s Law moves from prediction to outcome. It is not the moment the problem appeared. It is not the moment the signal was compressed. It is not the moment ownership was unclear. It is the moment the available window closed while the decision was still being made.
This distinction matters because it locates the failure with surgical precision. Every condition that preceded the Norman Failure Condition was addressable. The problem could have been named more specifically. The signal could have been transmitted with the clock attached. Ownership could have been assigned in the room. All of those interventions were available — until the window closed. After that, they are post-mortems.
The Norman Failure Condition is also a predictive instrument. Because Norman Decision Time can be tracked and the Norman Decision Window can be measured for recurring decision types, the Failure Condition can be anticipated before it occurs. When Norman Decision Time is trending upward and approaching the Norman Decision Window for a given class of decisions, the condition is forming. Intervention is still possible. The window has not yet closed. This is the diagnostic lead time the framework provides — not analysis of what failed, but real-time identification of what is about to fail, with time remaining to prevent it.

Internal Signal Compression is the advanced layer. It describes what happens inside the person who receives the signal — not just what happens to the signal as it moves through the organization. It is the reason a leader can receive a clear, uncompressed signal and still fail to act correctly within the Norman Decision Window.
When a high-stakes alert arrives under pressure, the amygdala fires before the prefrontal cortex has finished reading the message. Cortisol and adrenaline release. Heart rate increases. Breathing shallows. The threat response — designed for physical danger — is now running the operating system of a complex multi-variable decision. And what it does to that decision is specific, predictable, and measurable.
The Five Distortions of Internal Signal Compression
The threat response produces five specific distortions that compress the internal signal before the decision is made:
Distortion 1 — Tunnel Vision
Attention narrows to the most emotionally loud threat, not the most operationally solvable constraint. The supplier problem that has a solution becomes secondary to the relationship anxiety that does not. The mind moves toward what hurts most, not what can be fixed fastest.
Distortion 2 — Time Distortion
The Norman Decision Window feels shorter than it is. The urgency the nervous system generates is disproportionate to the actual decision window. This creates pressure to act before thinking — which is the most dangerous state for a decision that requires thinking.
Distortion 3 — Binary Collapse
The prefrontal cortex — responsible for holding multiple variables simultaneously — gets flooded by the limbic system. Options collapse into either/or. The space between those poles, where the actual solution lives, disappears. The leader can no longer see the range of options that exists.
Distortion 4 — Social Threat Compounding
Status and credibility risk are processed by the nervous system with the same urgency as operational risk. The CFO’s forwarded email without comment lands as a physical threat. The decision is no longer just operational — it is now personal. The nervous system cannot distinguish between these threats. It treats them all as equally urgent and equally physical.
Distortion 5 — Selective Reception
The mind begins softening what it is willing to fully receive. Uncertainty gets collapsed into worst case — or into denial. “Could affect Friday’s shipment” becomes “will fail” or “probably fine” depending on the direction the threat response pushes. Both are distortions. Both produce the wrong decision. This is signal compression operating inside the person, not the organization.
Internal Signal Compression is why no management operating system alone can guarantee decisions within the Norman Decision Window. The system may transmit the truth perfectly. The internal system of the person receiving it may filter it before it can be used. This is the failure point that requires a different instrument — the Inner Operating System — addressed in Sections 3 and 7.
The Complete Causal Chain
The Three Failure Points
Every organizational failure this framework has been applied to reduces to one or more of three structural failure points. They are distinct. They require distinct interventions. Conflating them is why most corrective efforts address the wrong link in the chain.
Failure Point 1 — Signal Compression
The problem loses urgency as it moves up. Leadership receives a diluted version of reality — not false, but softened beyond utility. The decision is made on distorted input. Intervention: protect signal integrity at every layer.
Failure Point 2 — Window Separation
The Norman Decision Window stays at the floor while the signal travels up. Leadership makes a time-sensitive decision without knowing the clock is running. Intervention: attach Decision Required By timestamp to every escalation at every layer.
Failure Point 3 — Ownership Diffusion
By the time the signal reaches the decision level, accountability has been distributed across enough people that nobody acts at the speed the Norman Decision Window requires. The Norman Failure Condition is met. Intervention: one owner, one outcome, one deadline — assigned in the room before the meeting ends.
SECTION 2
Measuring Norman’s Gap
The framework produces a quantified gap through three sequential measurements: External Pressure, Internal Regulation, and the Gap itself. Each measurement is grounded in observable behavior — not narrative, not opinion, and not self-report alone.
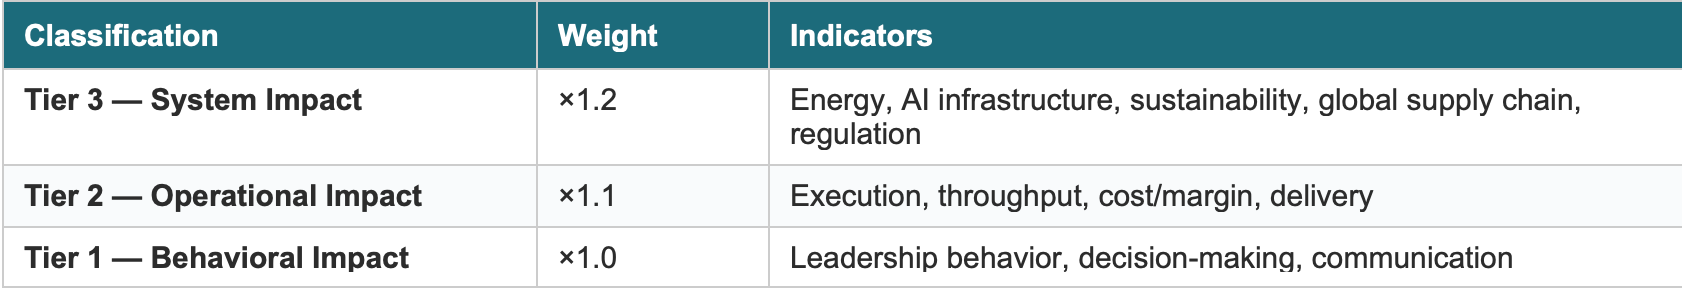
2.1 External Pressure
External Pressure reflects the intensity and consequence-level of forces acting on the system. Scored across two dimensions: Tier Classification and Severity Rating.
Tier Classification — Consequence Level
Severity Rating — Reality Diagnostic
Severity is assessed across three observable dimensions: Visibility (can the problem be clearly seen and named at the floor level?), Spread (is it affecting multiple functions or teams simultaneously?), and Persistence (is it ongoing without resolution across multiple cycles?). Each confirmed dimension increases the severity anchor.
These bands represent practitioner-derived thresholds calibrated across organizational observations. They are meaningful starting points, not fixed constants, and are subject to refinement as the diagnostic dataset grows.
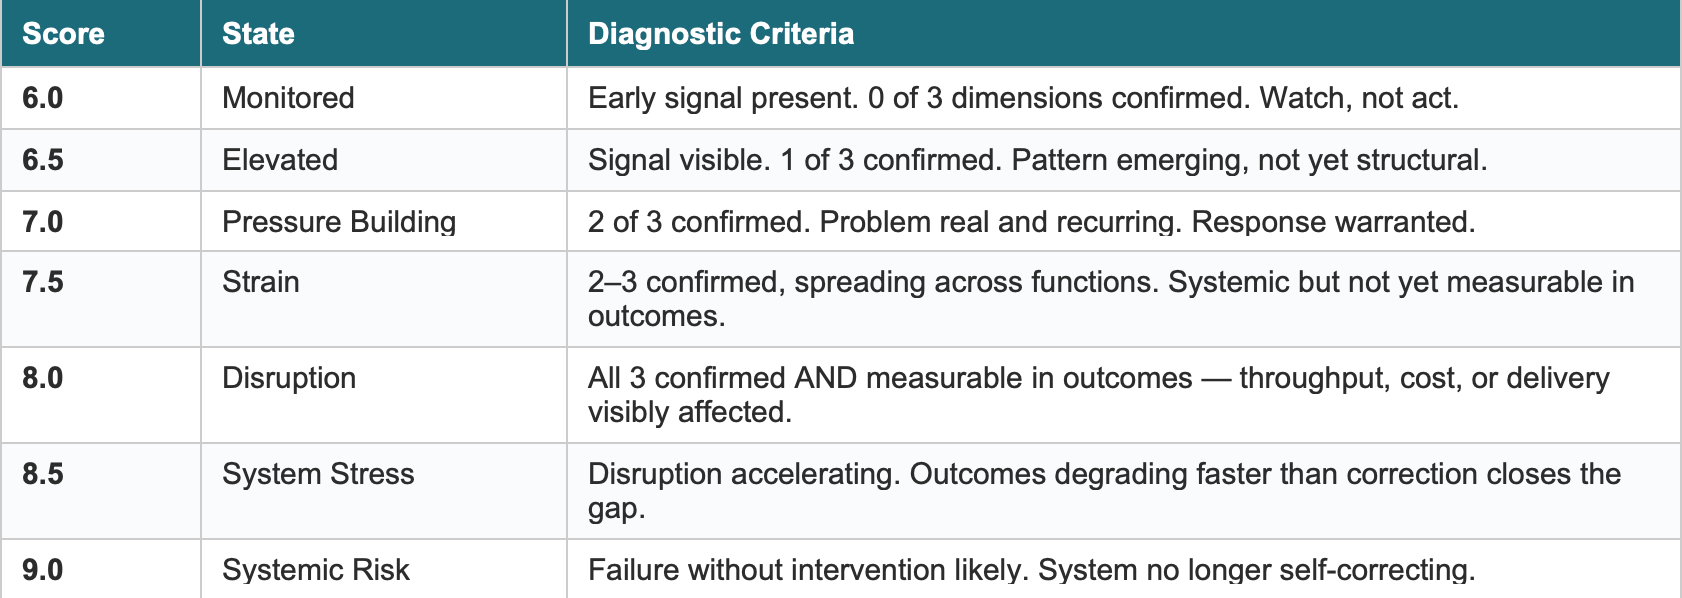
Critical Distinction: 7.5 vs 8.0
At 7.5, all three dimensions may be confirmed — but pressure remains observable in behavior, not yet measurable in outcomes. At 8.0, the confirmation is numerical: throughput has dropped, cost has risen, delivery has slipped. The shift from 7.5 to 8.0 is the shift from visible pattern to measurable consequence — which determines whether the intervention required is preventive or corrective.
External Pressure Score = Severity × Tier Weight. Floor: 6.0. Cap: 9.0.
2.2 Internal Regulation
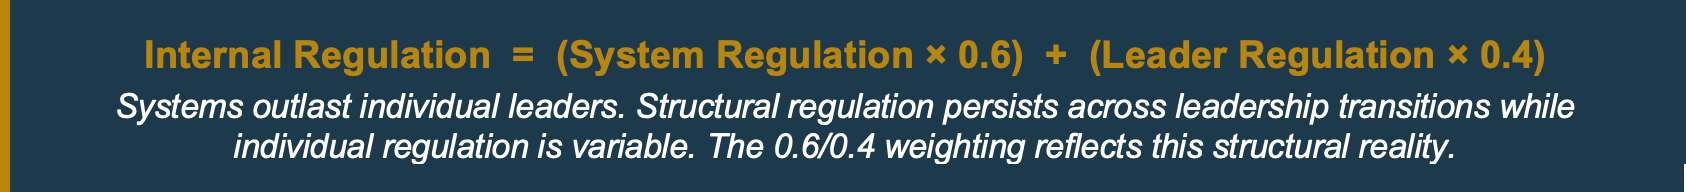
When the two component scores diverge significantly, the divergence itself is diagnostic. A high System score with a low Leader score identifies a well-architected organization disrupted by individual behavior under pressure. A high Leader score with a low System score identifies a capable leader operating inside a structurally broken system. These are fundamentally different conditions requiring fundamentally different interventions.
System Regulation Score (0–10)
Measures whether the organization can convert signal into action without delay or distortion. Scored across four factors on a three-point behavioral scale, each anchored to observable evidence. Minimum score per factor: 0.5. System Regulation floor: 2.0. Maximum: 10.0.
Floor note: A System Regulation score of 2.0 is not zero regulation. It is the lowest measurable level of functional regulation before the system ceases to operate as a coherent organization.
Factor | Score | Observable Behavioral Evidence
Ownership Clarity | 2.5 — Strong | Issues assigned to a named owner immediately and consistently. Ownership does not diffuse under pressure.
Ownership Clarity | 1.5 — Mixed | Ownership inconsistent. Assignment happens but erodes when pressure increases or boundaries are unclear.
Ownership Clarity | 0.5 — Weak | Accountability routinely diffused. Shared ownership is the default. No single name is accountable for outcomes.
Decision Speed | 2.5 — Strong | Signal-to-decision cycle measured in hours. Decisions made at the level they belong to without unnecessary escalation.
Decision Speed | 1.5 — Mixed | Cycle measured in days. Delays common. Decisions frequently require additional review before commitment.
Decision Speed | 0.5 — Weak | Cycle measured in weeks. Decisions avoided, deferred, or escalated beyond their appropriate level.
Escalation Discipline | 2.5 — Strong | Problems move up cleanly and completely. Raw signal reaches decision-makers intact. Window travels with the signal.
Escalation Discipline | 1.5 — Mixed | Escalation inconsistent. Information softened or reframed in transit. Clock separated from signal.
Escalation Discipline | 0.5 — Weak | Problems routinely buried or stalled. Signal Compression is structural, not incidental.
KPI Truth | 2.5 — Strong | Metrics real, unfiltered, reviewed without adjustment. Bad news presented with the same clarity as good news.
KPI Truth | 1.5 — Mixed | Metrics adjusted or summarized before reaching leadership. Underperformance contextualized, not named.
KPI Truth | 0.5 — Weak | Metrics systematically politicized or withheld. Leadership decides on outputs that do not reflect reality.
Leader Regulation Score (0–10)
Measures whether the leader can absorb pressure without distorting the system. Three factors on a 1–10 continuous scale, each anchored to observable behavior. Minimum per factor: 1. Leader Regulation floor: 1.0. Maximum: 10.0.
Architectural note: Leader Regulation uses a continuous scale because leader behavior under pressure exists on a spectrum, not a discrete three-state model. Floor asymmetry between System (2.0) and Leader (1.0) is intentional: a leader at their lowest functional state may be providing no effective regulation and may be actively destabilizing the system. Individual behavioral failure can be more complete than systemic structural failure.
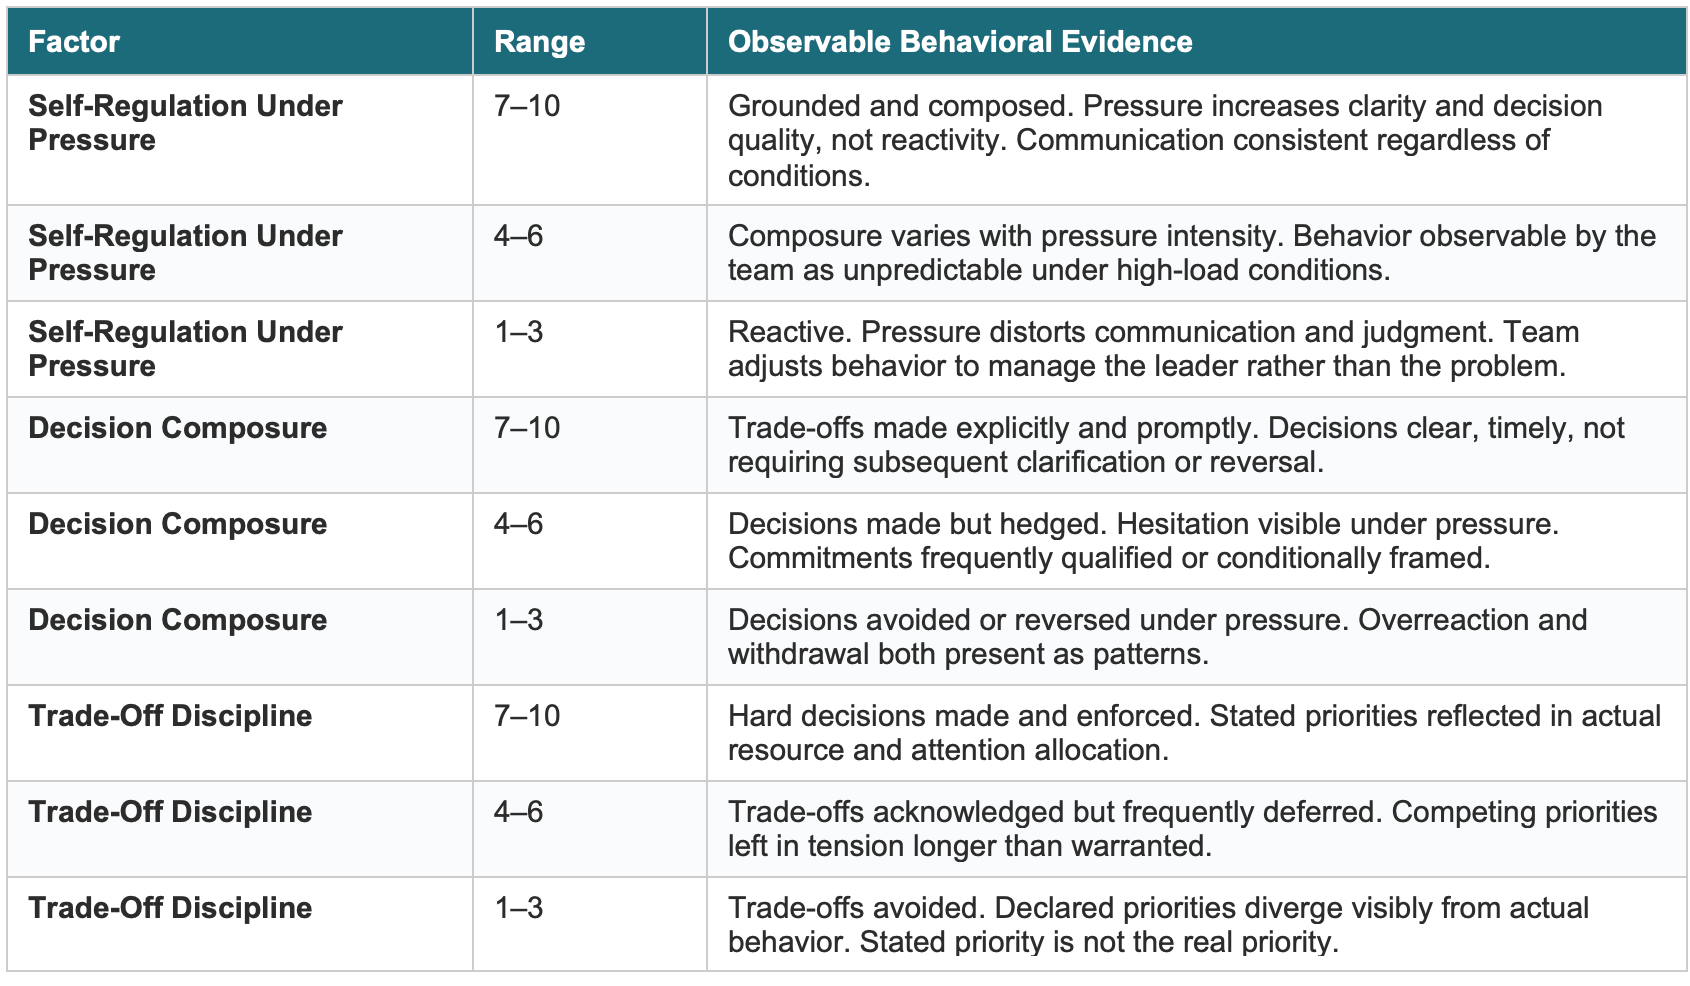
Reading the Components Together
A composite Internal Regulation score of 5.5 reached by System 7.0 / Leader 3.25 is structurally different from 5.5 reached by System 4.0 / Leader 8.0. The formula produces the same number. The intervention required is entirely different. The composite shows urgency. The components show where to act. Never read the composite in isolation.
SECTION 3
The Decision Window Framework
Sections 1 and 2 measure the structural gap between external pressure and internal regulation at the system level. That measurement tells leaders the condition the system is in. What it does not tell them is whether the system can act in time — for the specific decision, in the specific window, the situation provides.
This section operationalizes the Norman Decision Window, Norman Decision Time, the Norman Failure Condition, and Regulated Decision Time as event-level instruments.
3.1 Window Separation — The Most Dangerous Failure Mode
The Norman Decision Window travels with the raw signal. It does not survive Signal Compression.
When the signal is summarized or softened at any layer, the clock stays behind at the floor. Leadership receives the problem without knowing the time. This is Window Separation — and it is distinct from Signal Compression in a way that matters for intervention.
3.3 Norman Decision Time as the Primary Leadership KPI
Norman Decision Time is tracked at three levels of granularity. Each level identifies a different failure point:
• Signal to Escalation — how long from floor-level signal clarity to the signal reaching the decision level. Identifies Signal Compression and Window Separation failures.
• Escalation to Ownership — how long from the signal arriving at decision level to one named individual being assigned the outcome. Identifies Ownership Diffusion failures.
• Ownership to Decision — how long from ownership assignment to a committed decision with a defined resolution standard and return date. Identifies Internal Signal Compression and Decision Composure failures.
The sum of these three is Norman Decision Time. Compared against the Norman Decision Window for that decision type, it tells the organization whether the Norman Failure Condition was met, approached, or avoided.
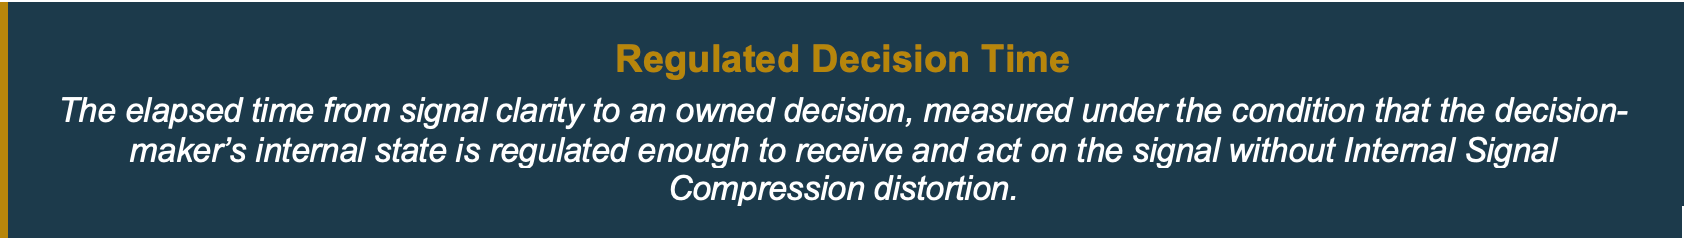
3.4 Regulated Decision Time — Where MOS Meets IOS
Regulated Decision Time bridges the two systems most organizations treat as entirely separate:
• MOS (Management Operating System) — tracks the external timeline: signal to escalation, escalation to ownership, ownership to decision. Measurable at the organizational level.
• IOS (Inner Operating System) — determines whether the external timeline is usable. Whether the decision-maker’s internal state is regulated enough to receive the signal without the five distortions of Internal Signal Compression compressing it before it can be acted on.
A leader in full threat response has a Norman Decision Window. They cannot access it clearly. The five distortions are operating. The decision they make is being made on a signal their internal system has already filtered. A regulated leader has the same window and can use the full available time with the full available information.
Heart Rate Variability (HRV), tracked continuously through wearable devices, provides an objective real-time measure of the autonomic nervous system’s regulatory state. Lower HRV indicates sympathetic activation — the threat response is running and Internal Signal Compression is present. Higher HRV indicates parasympathetic dominance — the prefrontal cortex is available for complex decision-making. HRV converts Regulated Decision Time from a concept into a measurable KPI.
The Signature Norman Concept
MOS tracks the timeline. IOS determines whether the timeline is usable. Regulated Decision Time is where both systems meet — and where the Norman Decision Window is either preserved or lost.
SECTION 4
The Role of the Observer
Core Principle
If it cannot be observed, it cannot be scored. Every score in this framework is anchored to directly observable behavioral evidence. Narrative, reputation, and self-report are not scoring inputs.
System Regulation can be scored by any qualified operator with sufficient organizational access. The evidence is external, behavioral, and verifiable. Two observers with access to the same organization should arrive within one point of each other on any factor. Where they diverge, the divergence itself is diagnostic — it identifies where the system’s behavior is ambiguous or context-dependent.
Leader Regulation presents a more complex challenge. Its factors — composure under pressure, decision clarity, trade-off discipline — require either direct behavioral observation or structured self-assessment. Self-assessment alone is insufficient. Leaders systematically overrate their composure and decision clarity under the same conditions of pressure the model is designed to detect. This is not a character flaw; it is a well-documented cognitive pattern that HRV data consistently confirms. The instrument must account for it.
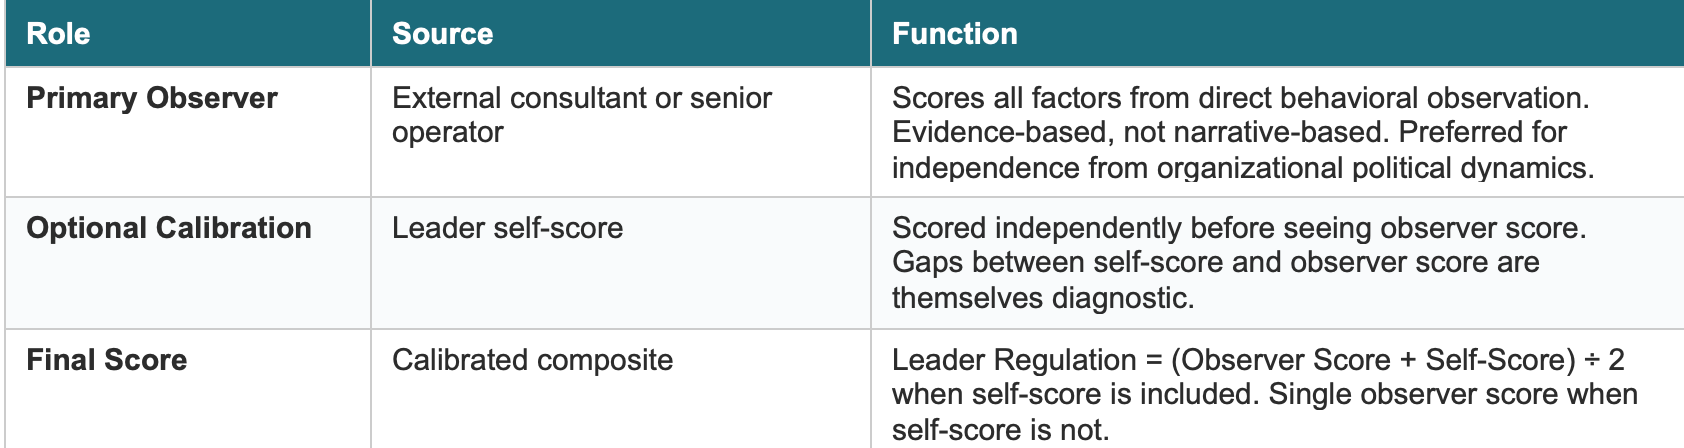
When a significant gap exists between the observer score and the self-score on any Leader Regulation factor, that gap is not noise. It is signal. It identifies exactly where the leader’s self-perception diverges from observable behavior — and that divergence is frequently the precise location of the organization’s execution breakdown. A leader who scores themselves 8 on Trade-Off Discipline while an external observer scores them 3 has revealed, in that gap, why the stated priorities are not the actual priorities.
SECTION 5
Calculating and Interpreting the Gap
Gap Score — Public Metric
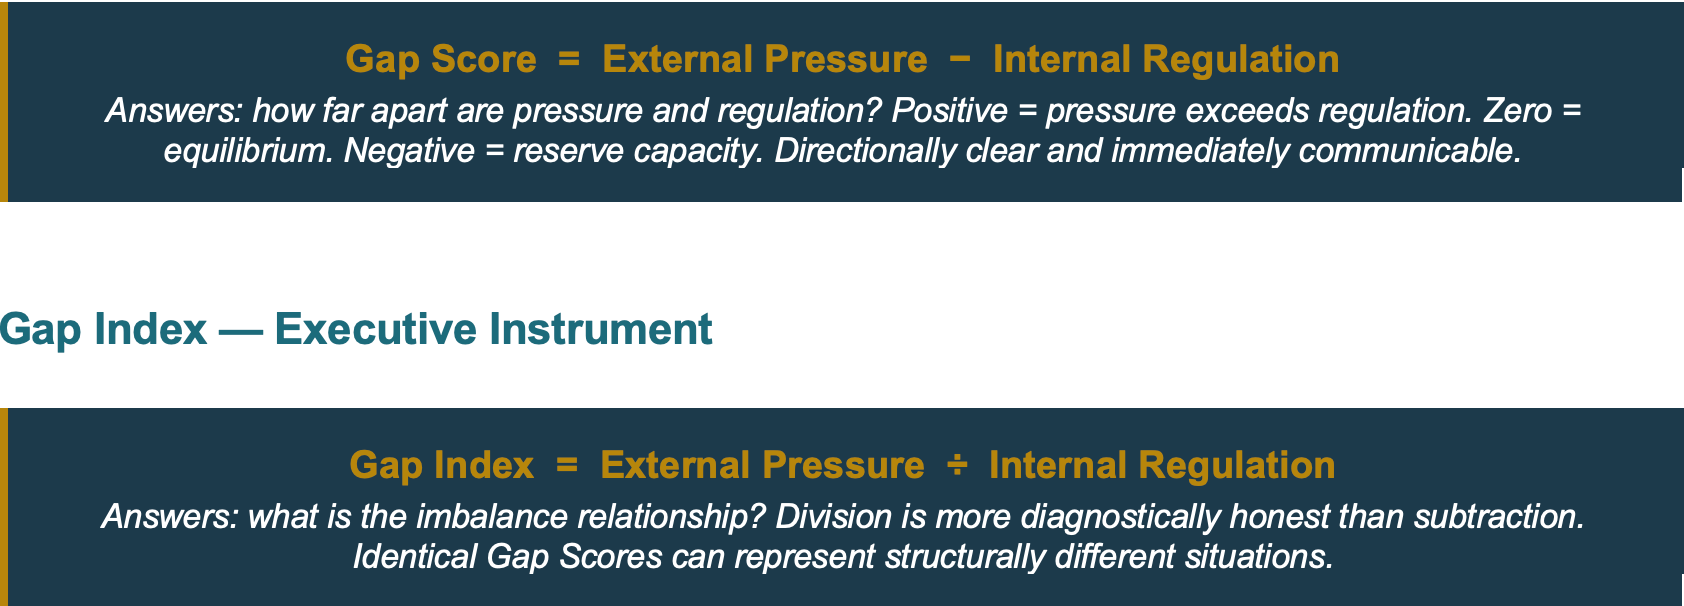
A Gap Score of 2.0 when pressure is 8.0 and regulation is 6.0 appears identical to a Gap Score of 2.0 when pressure is 3.0 and regulation is 1.0. The Gap Index reveals these are structurally different situations. The first system is under high load with meaningful regulation remaining. The second is under low load with almost no regulation — and is therefore far more fragile to any additional pressure.
Direction Indicator
A single score at a point in time is a diagnostic. A score with a direction indicator is a prognosis. The direction indicator is the most important element of the Gap Index for operational use.
• ↑ Gap widening — pressure increasing faster than regulation can adapt, or regulation actively deteriorating
• → Gap stable — system in equilibrium, whether that equilibrium is healthy or fragile
• ↓ Gap closing — regulation improving faster than pressure is increasing, or pressure receding
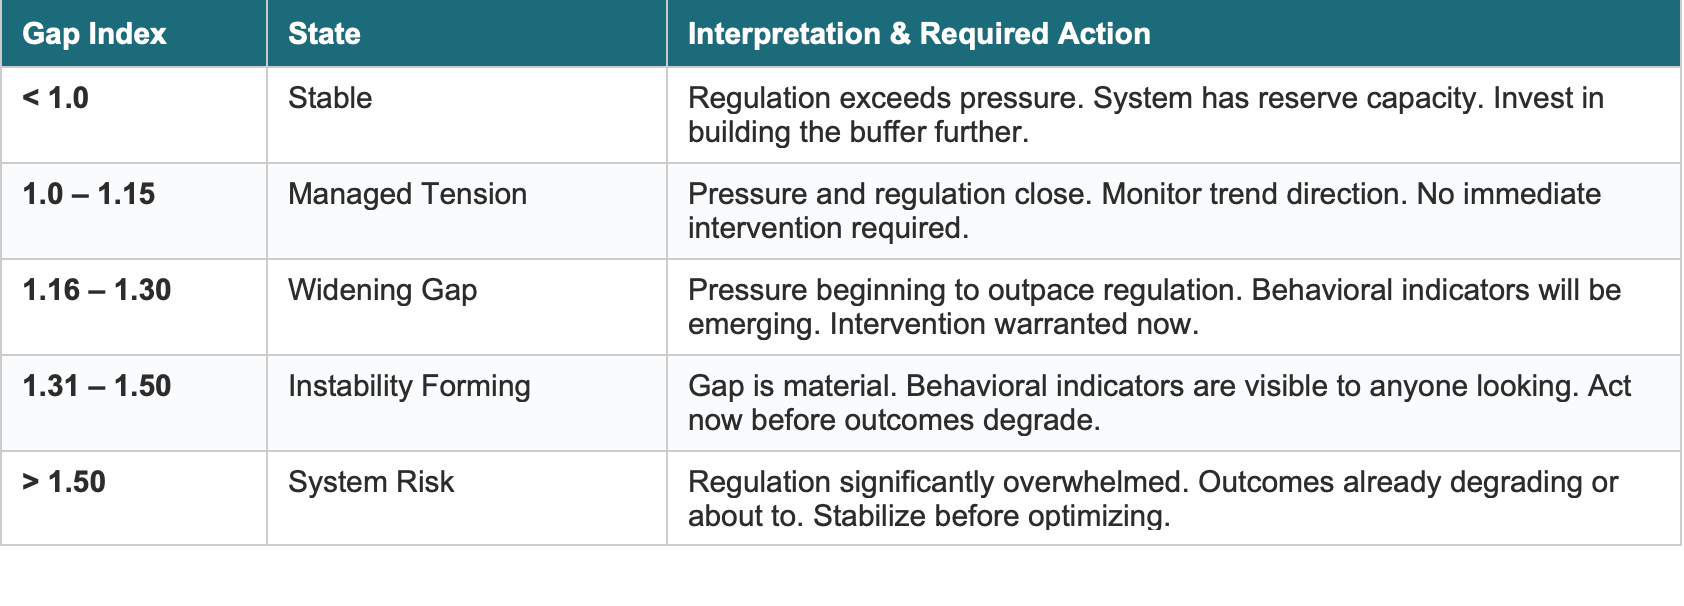
A Gap Index of 1.35 with a ↓ direction indicator represents a fundamentally different situation than a 1.35 with a ↑ indicator. The first is a system that has been worse and is correcting. The second is a system approaching the System Risk threshold with no indication of reversal. The number without the direction is incomplete data.
SECTION 6
Applied Examples
The following examples illustrate the full framework applied to real organizational patterns across three scales: system level, event level, and human level. Details have been abstracted for confidentiality where applicable.
Example 1 — Sustainability Initiative (System Level)
Context
A mid-size manufacturing organization declared sustainability a strategic priority at the executive level. Targets were set. Initiatives were announced. Twelve months later, no material progress had been made. Leadership attributed the failure to culture and was preparing to invest in a change management program.
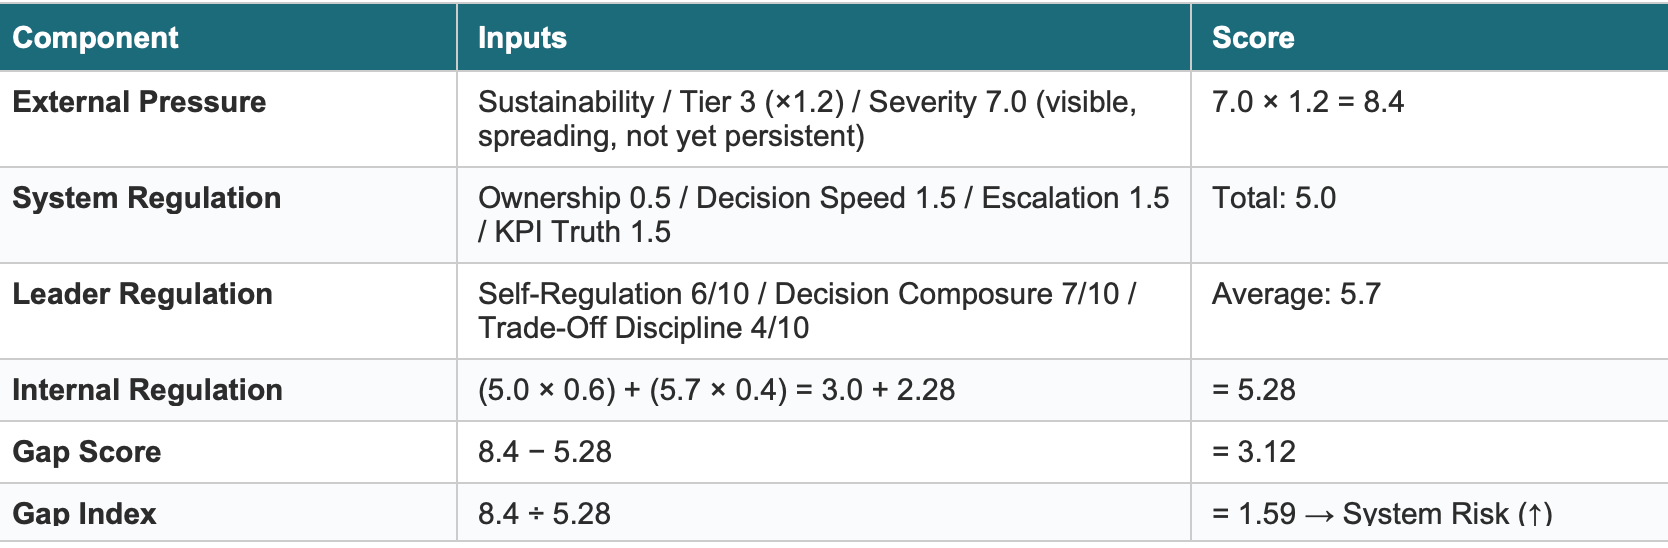
What the Diagnostic Revealed
The organization did not have a culture problem. It had a regulation problem with three specific failure points:
• Ownership Clarity scored 0.5. Sustainability was declared “everyone’s responsibility” — which meant no one moved. When everything belongs to everyone, nothing belongs to anyone.
• Trade-Off Discipline scored 4/10. The executive team acknowledged sustainability as a priority but consistently protected cost and output when they came into conflict. Observable behavior revealed the actual priority hierarchy, which differed from the declared one.
• The Gap Index of 1.59 placed the organization in System Risk. The planned culture program would have addressed stated values while leaving ownership clarity, trade-off discipline, and decision speed entirely unchanged — the three factors actually driving the failure.
Intervention applied: one named owner per initiative, explicit trade-off decisions documented and enforced at the executive level, KPIs tied to measurable outcomes rather than activity. Twelve weeks later: Gap Index 1.21, direction indicator ↓.
Example 2 — Container Shortage (Norman Decision Window / Event Level)
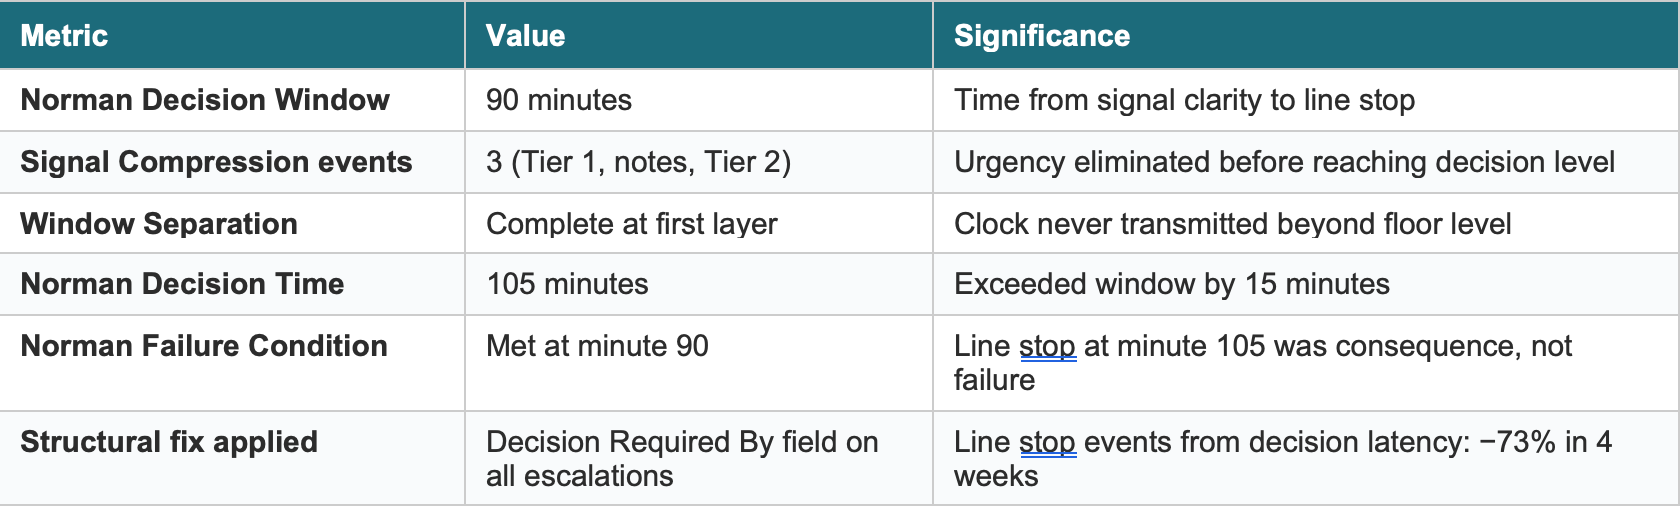
Example 3 — Supplier Alert Decision (Regulated Decision Time / Human Level)
Context
A senior operations leader received a supplier alert at 6:47 AM. Critical component delayed. Friday’s shipment — $2.1 million, 23% of quarterly revenue — at risk. Customer logistics window closing in four hours. Penalty clause exposure: $180,000. The threat response activated within ninety seconds of reading the alert.
Measure | Without Regulation | With Regulation
Internal state at decision point | Threat response active. Internal Signal Compression engaged. All five distortions present. | 30 seconds regulated breath. Parasympathetic response activated. Prefrontal cortex available.
Questions separated | No. Three separate threats fused into one undifferentiated urgency. | Yes. Three questions separated: operational, relational, financial. Each assigned an owner.
First action taken | Customer call. Relationship anxiety answered first. Wrong constraint prioritized. | Procurement assigned the constraint. Right problem addressed first. 30-minute deadline set.
Norman Decision Time | Estimated 90–120 minutes | 37 minutes
Norman Failure Condition | Likely met | Not met. Window preserved with over 3 hours remaining.
Financial outcome | Penalty likely: –$180,000 | Alternative supplier secured: –$47,000 cost, –$180,000 penalty avoided. Net: +$133,000
The difference between the two scenarios was not data, experience, or strategic intelligence. It was thirty seconds of regulated breath before any external action was taken. That thirty seconds kept the prefrontal cortex available for the decision the situation required — and preserved the Norman Decision Window.
SECTION 7
Practical Application
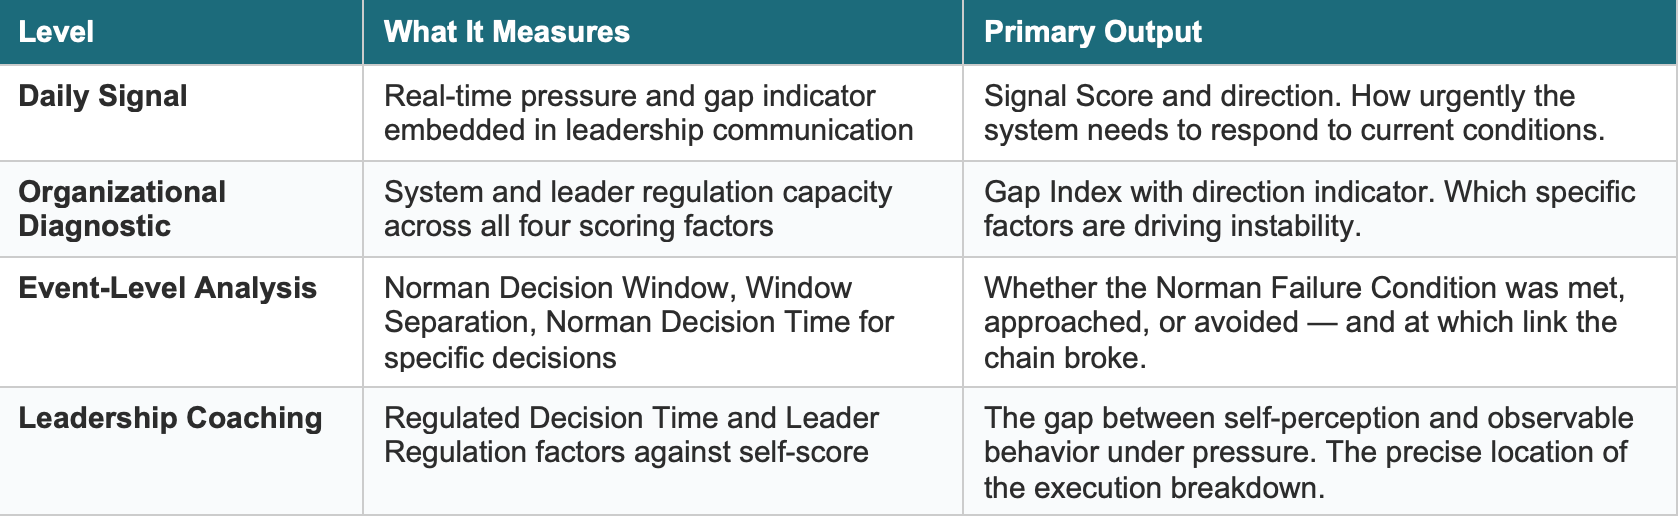
The Norman’s Gap framework is designed for operational use, not academic application. It runs in under fifteen minutes once practitioners are familiar with the scoring model. It can be applied at four distinct levels:
MOS Integration — Three Structural Points
The framework integrates directly into any Management Operating System at three structural points. Each point addresses one of the three failure modes:
Tier Meeting Discipline — Addresses Window Separation
Every escalation at every tier carries two fields: the problem description and the Decision Required By timestamp. This is not a cultural ask. It is a structural requirement enforced at the meeting facilitation level. No escalation is complete without both fields. This single discipline eliminates Window Separation as a recurring failure mode.
KPI Dashboard Integration — Addresses Signal Compression
Norman Decision Time is tracked as a primary metric alongside throughput, OEE, and OTIF. Signal-to-Escalation time, Escalation-to-Ownership time, and Ownership-to-Decision time are each tracked separately. When any component begins trending upward, the Gap Index is already widening. The dashboard shows the gap before it shows in the outcome.
Leadership Review Protocol — Addresses Ownership Diffusion
Leader Regulation scores provide a behavioral mirror that most performance reviews never produce. Observer and self-scores are completed independently and compared. The gap between them is the most actionable data point the review generates. It identifies, with precision, where the leader’s internal model of their own behavior diverges from what the organization experiences.
IOS Integration — The Inner Operating System
Regulated Decision Time connects the MOS to the Inner Operating System — the leader’s internal capacity to receive and act on signals clearly under pressure.
The mechanism is specific and trainable. Before any high-stakes decision response, three to five rounds of extended exhale breath practice — inhale 4 counts, exhale 6 to 8 counts — activates the vagus nerve, reduces cortisol, and returns the prefrontal cortex to full availability. HRV tracking before and after provides objective confirmation that the internal state has shifted from sympathetic activation to parasympathetic regulation.
This is not a wellness practice appended to an operational framework. It is the neurological mechanism that determines whether the Norman Decision Window is accessible to the decision-maker. Without it, Internal Signal Compression operates invisibly, the five distortions run undetected, and Norman Decision Time extends beyond what any system design can compensate for.
The regulated leader sees options. The unregulated one sees threats. That distinction — at the human level — determines whether the Norman Failure Condition is met.
Longitudinal Application
In consulting practice, the framework is most powerful when applied longitudinally. A single Gap Index score is a data point. A series of scores over four to twelve weeks reveals whether interventions are closing the gap or whether pressure is accelerating faster than regulation can adapt.
The trend line is the most valuable output the framework produces. A Gap Index of 1.35 declining over six weeks is a fundamentally different situation from a 1.35 that has been rising for six weeks. The number is the same. The prognosis is not. The direction indicator makes this distinction visible before it appears in outcomes.
CONCLUSION
Organizations do not fail because they lack intelligence. They fail because they cannot act on what they already know — fast enough, with sufficient ownership, within the window the situation provides.
Norman’s Gap provides a way to measure that failure before it becomes visible in outcomes. It shifts the diagnostic focus from performance — what the system produced — to response capacity: what the system is capable of doing with what it already knows, in the time it has to act.
The gap between external pressure and internal regulation is always present. The question is whether it is growing or closing, whether the signal is traveling clearly with the clock attached, and whether the leader who receives it is regulated enough to act before the Norman Failure Condition is met.
This framework makes all three measurable. And in doing so, it gives leaders the one thing most diagnostics withhold:
Enough lead time to respond before the Norman Failure Condition is reached.
What a leader must see. What a leader must own. What a leader must do next.
— End of White Paper —
SOURCES AND METHODOLOGY
Framework Development
The Norman’s Gap framework was developed through direct field observation and applied practice across manufacturing operations, executive leadership, and organizational consulting contexts spanning more than a decade. The scoring models, behavioral anchors, diagnostic thresholds, and named laws presented in this paper are original intellectual contributions derived from observed organizational behavior, not adapted from existing theoretical models.
The framework is practitioner-first: every component was designed to be applied in real operating environments by qualified observers, not administered in controlled research settings. Thresholds and band definitions are calibrated starting points subject to ongoing refinement as the diagnostic dataset grows.
Supporting Literature and Disciplines
While the named concepts and their operational definitions are original, the framework draws on and is consistent with established bodies of knowledge in the following disciplines:
Systems Theory and Organizational Dynamics
• Senge, P. (1990). The Fifth Discipline: The Art and Practice of the Learning Organization. Doubleday.
• Perrow, C. (1984). Normal Accidents: Living with High-Risk Technologies. Basic Books.
• Weick, K. (1995). Sensemaking in Organizations. Sage Publications.
Decision-Making Under Pressure
• Kahneman, D. (2011). Thinking, Fast and Slow. Farrar, Straus and Giroux.
• Klein, G. (1998). Sources of Power: How People Make Decisions. MIT Press.
• Ariely, D. (2008). Predictably Irrational. HarperCollins.
Leadership and Operational Execution
• Drucker, P. (1967). The Effective Executive. HarperCollins.
• Collins, J. (2001). Good to Great. Harper Business.
• Goldratt, E. (1984). The Goal: A Process of Ongoing Improvement. North River Press.
Neuroscience and Physiology of Performance
• Sapolsky, R. (2004). Why Zebras Don’t Get Ulcers. Holt Paperbacks.
• Porges, S. (2011). The Polyvagal Theory. Norton.
• Huberman, A. (2021–present). Huberman Lab Podcast. Stanford University School of Medicine. hubermanlab.com.
Historical Case References
• Gibbon, E. (1776–1789). The History of the Decline and Fall of the Roman Empire.
• Sheehan, N. (1988). A Bright Shining Lie. Random House. [Vietnam War / McNamara signal compression]
• United States Chemical Safety Board (2016). Deepwater Horizon Investigation Report.
Original Author Works
• Applegate, N. (2025). Regulate: The Inner Operating System for Leaders Under Pressure.
• Applegate, N. (2024–present). The Daily Signal. Daily leadership and systems intelligence publication.
A Note on Replication
Practitioners seeking to apply or validate the scoring methodology should note: inter-rater reliability is highest when both observers have direct access to the same organizational environment over a minimum of two weeks of operational observation. Single-session assessments are useful for directional orientation but should be interpreted with appropriate caution. The framework is designed for longitudinal application - its predictive value increases substantially with repeated measurement over time.
ABOUT THE AUTHOR
Norman Applegate is the founder of The Daily Signal and the author of Regulate: The Inner Operating System for Leaders Under Pressure.
He has spent more than a decade working directly inside manufacturing operations, executive leadership teams, and organizational turnaround environments — observing, measuring, and closing the gap between what systems know and what they are capable of acting on. The frameworks in this paper are the direct product of that work.
Norman’s Law, Norman’s Gap, and the seven named laws in this white paper represent the formalization of patterns he has observed repeat — with striking consistency — across industries, organizational sizes, and leadership profiles. The language is new. The failure is not.
The Daily Signal is a daily leadership and systems intelligence publication read by operators, executives, and leaders who work under sustained pressure and need clarity — not volume — to navigate it.
For speaking, consulting, licensing, or publishing inquiries:
Norman Applegate • The Daily Signal • normansapplegate@mac.com
THE DAILY SIGNAL
Pressure Moves. Ownership Decides.
Regulate → Decide → Move
© 2025 Norman Applegate. All rights reserved.